PRICE T ROWE GROUP (TROW)·Q4 2025 Earnings Summary
T. Rowe Price Misses EPS on Restructuring Charges as Outflows Hit $57B for 2025
February 4, 2026 · by Fintool AI Agent
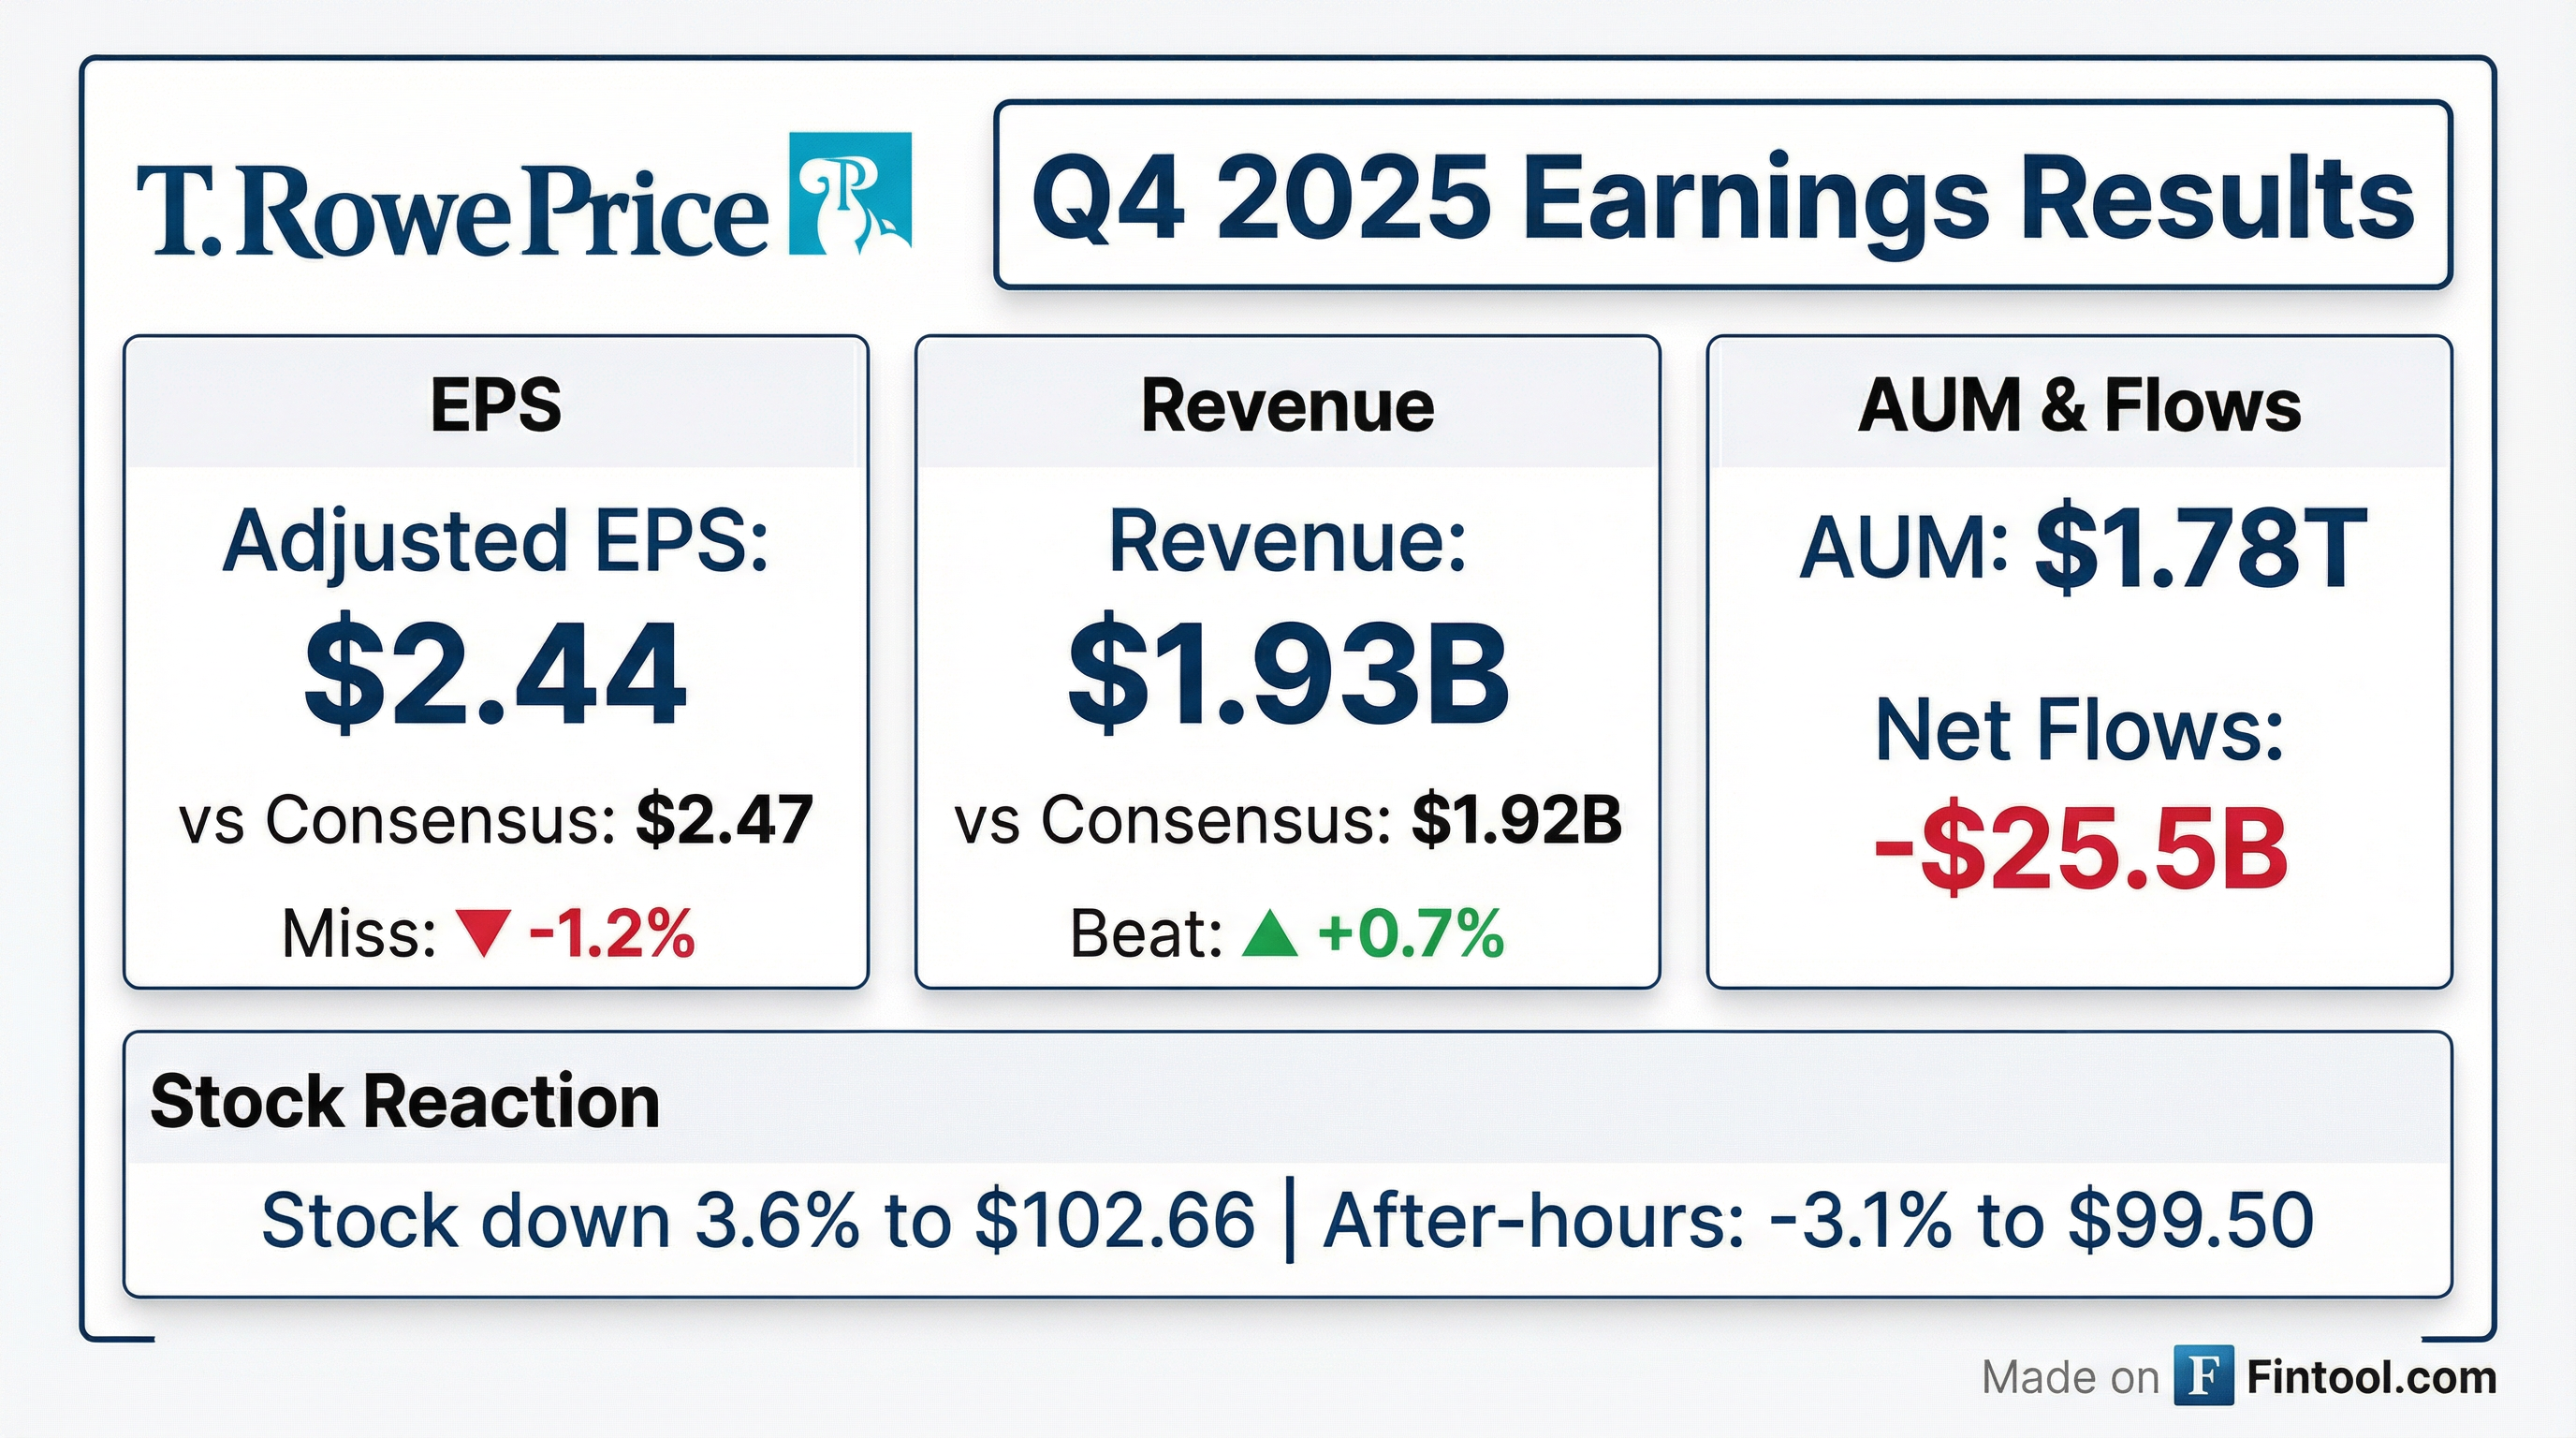
T. Rowe Price (NASDAQ: TROW) reported Q4 2025 results this morning that missed EPS consensus while slightly beating on revenue. Adjusted EPS of $2.44 fell short of the $2.47 Street estimate, bringing full-year adjusted diluted EPS to $9.72, up 4.2% from 2024. The stock declined 3.6% in regular trading to $102.66.
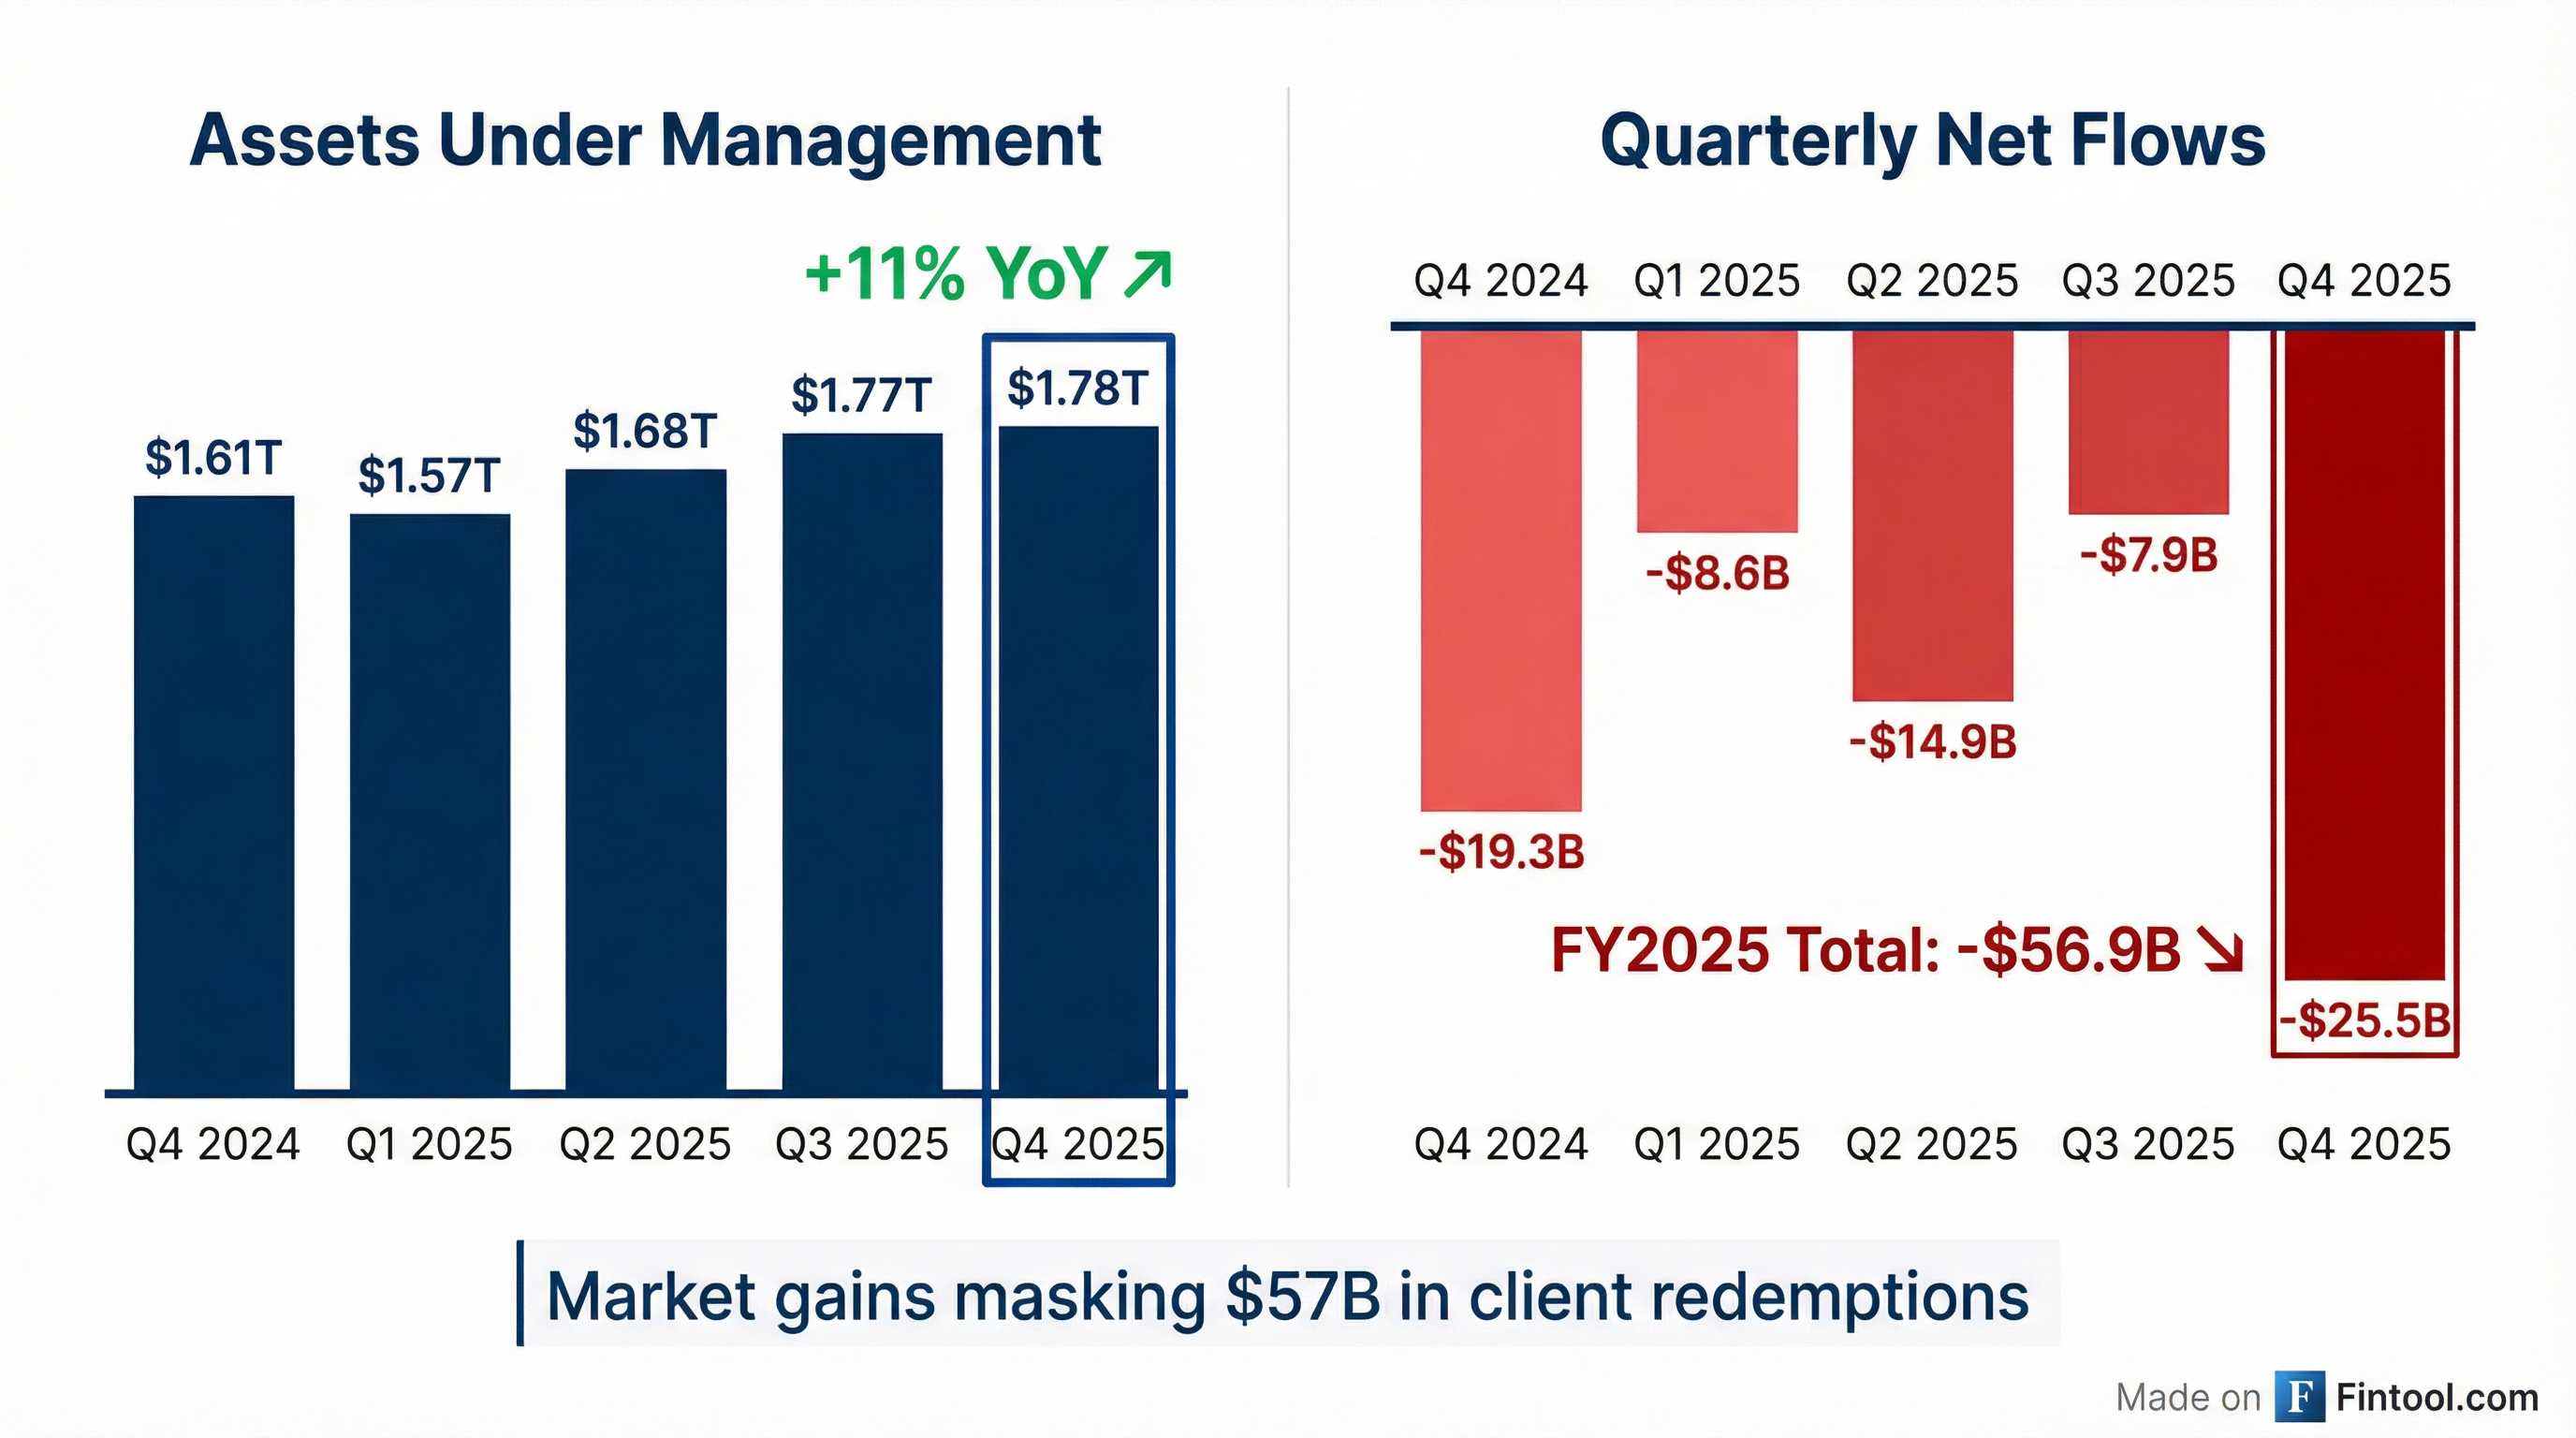
The bigger story: despite rising equity markets lifting AUM to $1.78 trillion (+10% YoY), clients pulled $56.9 billion from T. Rowe funds in 2025. Net outflows were concentrated in equity and mutual funds, with $75B in equity outflows and nearly $64B from mutual funds. CEO Rob Sharps acknowledged "it remains a narrow market dominated by a handful of mega cap stocks... not an environment highly conducive to fundamental research, active management, and long-term investing."
Did T. Rowe Price Beat Earnings?
Mixed results: Revenue beat, EPS missed.
The EPS miss was driven primarily by:
- Restructuring charges: $148.8M in Q4 2025 (part of $177.3M full-year restructuring program)
- Fee rate compression: Investment advisory effective fee rate fell to 38.8 bps from 40.5 bps a year ago
- Higher compensation expenses: Compensation and related costs increased despite efficiency initiatives
How Did the Stock React?
TROW shares fell sharply following the release:
- Pre-close (Feb 3): $106.65
- Close (Feb 4): $102.66 (-3.6%)
- After-hours: $99.50 (-6.7% from prior close)
The stock is now trading 16% below its 52-week high of $118.22 and just above its 200-day moving average of $101.47. The analyst consensus target price of $107.42 suggests modest upside from current levels, but sentiment remains bearish with 4 of 14 analysts rating the stock a "Strong Sell."
What Changed From Last Quarter?
Key deterioration: Q4 net outflows of $25.5B were the worst quarter since Q4 2022, tripling from Q3's $7.9B. The adjusted operating margin dropped nearly 500 bps sequentially to 35.6% due to restructuring charges.
The Outflow Problem
T. Rowe Price's fundamental challenge remains client redemptions that persistently exceed new asset wins:
Where the outflows are coming from:
- Equities: -$74.9B for full year, -$23.2B in Q4 alone
- Target Date: -$5.4B in Q4 (though +$5.2B for full year 2025)
- U.S. clients: -$51.6B for the year vs -$5.3B internationally
The only bright spots: Fixed income (+$12.5B) and alternatives (+$3.7B) saw inflows, though not enough to offset equity redemptions.
Fee Compression Continues
The effective fee rate (EFR) has declined for four consecutive years:
Q4 2025's rate of 38.8 bps marked a new low. The decline reflects:
- Mix shift: Assets moving from higher-fee equity funds to lower-fee fixed income and target date products
- Vehicle shift: Growth in lower-fee vehicles (ETFs, collective investment trusts) vs. traditional mutual funds
- Competitive pressure: Industrywide fee compression from passive and low-cost active alternatives
Bright Spots: ETFs and Alternatives
Despite the headline challenges, several growth initiatives showed progress:
ETF Business:
- AUM reached $21B+ at year-end, with 13 new ETFs launched in 2025 bringing the total to 30
- Net flows of nearly $10.5B in 2025
- Launched 2 new active core ETFs (U.S. and international) combining quantitative and fundamental research
- Expanded fixed income ETF range with 3 new muni strategies and 1 multi-sector ETF
Alternatives/OHA:
- OHA had a second consecutive record fundraising year with over $16B in capital raised, led by private lending
- First close for T. Rowe Price-managed private equity fund in January 2026—a closed-end drawdown fund targeting ~25 category-leading private companies
- T. Rowe Price client teams helped bring in $3B+ in new OHA institutional commitments
- Management plans to host an OHA spotlight on a future earnings call with Glenn August
Target Date Franchise:
- Surpassed $560B in AUM across target date solutions
- Extended global leadership with sub-advised TDF in Japan and new retirement funds in Hong Kong/Singapore—first U.S. asset manager to offer retirement-focused retail products in those markets
- Launched Social Security Analyzer tool for retirement planning
Q&A Highlights
On January 2026 Flows: CEO Rob Sharps noted the company had just under $6B of outflows in January, though the pipeline suggests February and March could improve. Target date inflows were $1.7B in January alone.
On Target Date Dynamics: Sharps acknowledged fully active TDFs are losing share to passive and blend products. "Given our position as the largest fully active target date fund manager, that's going to be a headwind for us." However, T. Rowe Price's blend offerings are gaining share in the fastest-growing TDF category.
On AI Disruption: Following the DeepSeek-related market volatility, Head of Investments Eric Veiel stated: "What happened yesterday, in terms of the potential disruption of AI across different parts of the software industry, is not a surprise to us... we have been studying these opportunities and risks for a long time and have very deep research on them."
On Tokenization Strategy: Veiel outlined three vectors for blockchain investment—efficiency (middle/back office savings), product (convergence of public/private, fractionalization), and distribution (new crypto-native investors). T. Rowe Price has registered an active crypto ETF with the SEC expected to launch in 2026.
On Goldman Sachs Partnership: The co-branded Goldman Sachs T. Rowe Price Retirement Date fund incorporating OHA private credit is expected to launch around mid-2026.
Investment Performance
Performance showed improvement in several key strategies, though challenges remain in the narrow market environment:
Fixed income delivered strong results with over 75% of fund assets beating peer groups across all time periods.
2026 Expense Guidance
Management guided 2026 adjusted operating expenses (excluding carried interest) to increase 3-6% over 2025's $4.6B. The range reflects:
- Controllable expenses managed toward low single-digit growth
- Investments in ETFs, SMAs, model portfolios, alternatives, and advice solutions
- Market-driven expenses tied to AUM growth (12b-1, trailer fees)
- Year-end compensation accounting impacts from LTI programs
Capital Return and Balance Sheet
T. Rowe Price returned nearly $1.8B to shareholders in 2025 and generated over $2B of free cash flow.
- Dividends: 39th consecutive year of increases since 1986 IPO
- Buybacks: $624.6M (2.8% of shares outstanding)
The balance sheet remains strong with $3.8B in cash and discretionary investments, up $735M from the start of the year.
Full Year 2025 Summary
Strategic Partnerships
T. Rowe Price is aggressively expanding through partnerships:
Goldman Sachs Collaboration: Established in 2025 to pursue wealth and retirement opportunities through co-developed public-private offerings. Four co-branded model portfolios are now live on the GeoWealth platform, with a fifth expected in H1 2026. The Goldman Sachs T. Rowe Price Dynamic ETF Portfolio launched on Morgan Stanley's platform in January.
First Abu Dhabi Bank (FAB): Announced January 2026, this marks T. Rowe Price's first strategic partnership in the Middle East. The partnership aims to deliver investment solutions across public and private markets tailored for Middle East investors.
What to Watch
Near-term catalysts:
- Q1 2026 flows: January saw $6B outflows, but February/March pipeline looks improved
- Goldman Sachs retirement date fund launch: Expected mid-2026 with OHA private credit integration
- DOL guidance on privates in 401(k): Could unlock material opportunity in target date if clarity provided
- Active crypto ETF: SEC-registered, expected 2026 launch with multi-token approach
Forward estimates:
*Consensus estimates from S&P Global
Key Takeaways
- EPS miss on restructuring: $149M in charges obscured underlying profitability; adjusted EPS of $2.44 missed by 1.2%
- Outflows accelerating, but January TDF inflows strong: Q4's $25.5B was the worst quarter in two years, though January saw $1.7B TDF inflows
- Fee compression continues: Effective fee rate at new low of 38.8 bps, down from 39.1 bps sequentially
- Strategic partnerships accelerating: Goldman Sachs co-branded products live, FAB Middle East partnership, Goldman TDF with OHA credit launching mid-2026
- Innovation push: Active crypto ETF planned for 2026, blockchain/tokenization strategy across efficiency, product, and distribution
- OHA momentum: Second consecutive record fundraising year with $16B+ raised; spotlight call planned for later in 2026
View the full Q4 2025 earnings presentation or explore more on T. Rowe Price's company page.